Install
There is nothing to install in the database — no scratch schema, no packages, not a single write. Clone the repo on any machine with SQL*Plus and run.
- Oracle Database 19c with the Diagnostic + Tuning Pack licensed
(the toolkit reads
DBA_HIST_*). - A user that can read the AWR views — any
DBAaccount, or a dedicated analyst grantedSELECTon the handful of views listed in the README. A read-only standby that exposes AWR works too.
git clone https://github.com/davidbudac/awr_timeline_comparison.git
cd awr_timeline_comparison
The fleet console
The mode most people want: point run_awr_fleet.sh at a list of databases and get
one self-contained, worst-first ops console. It runs the same aligned-window,
z-score comparison against every database in parallel and sorts the results so the sickest
database is the first row on the page.
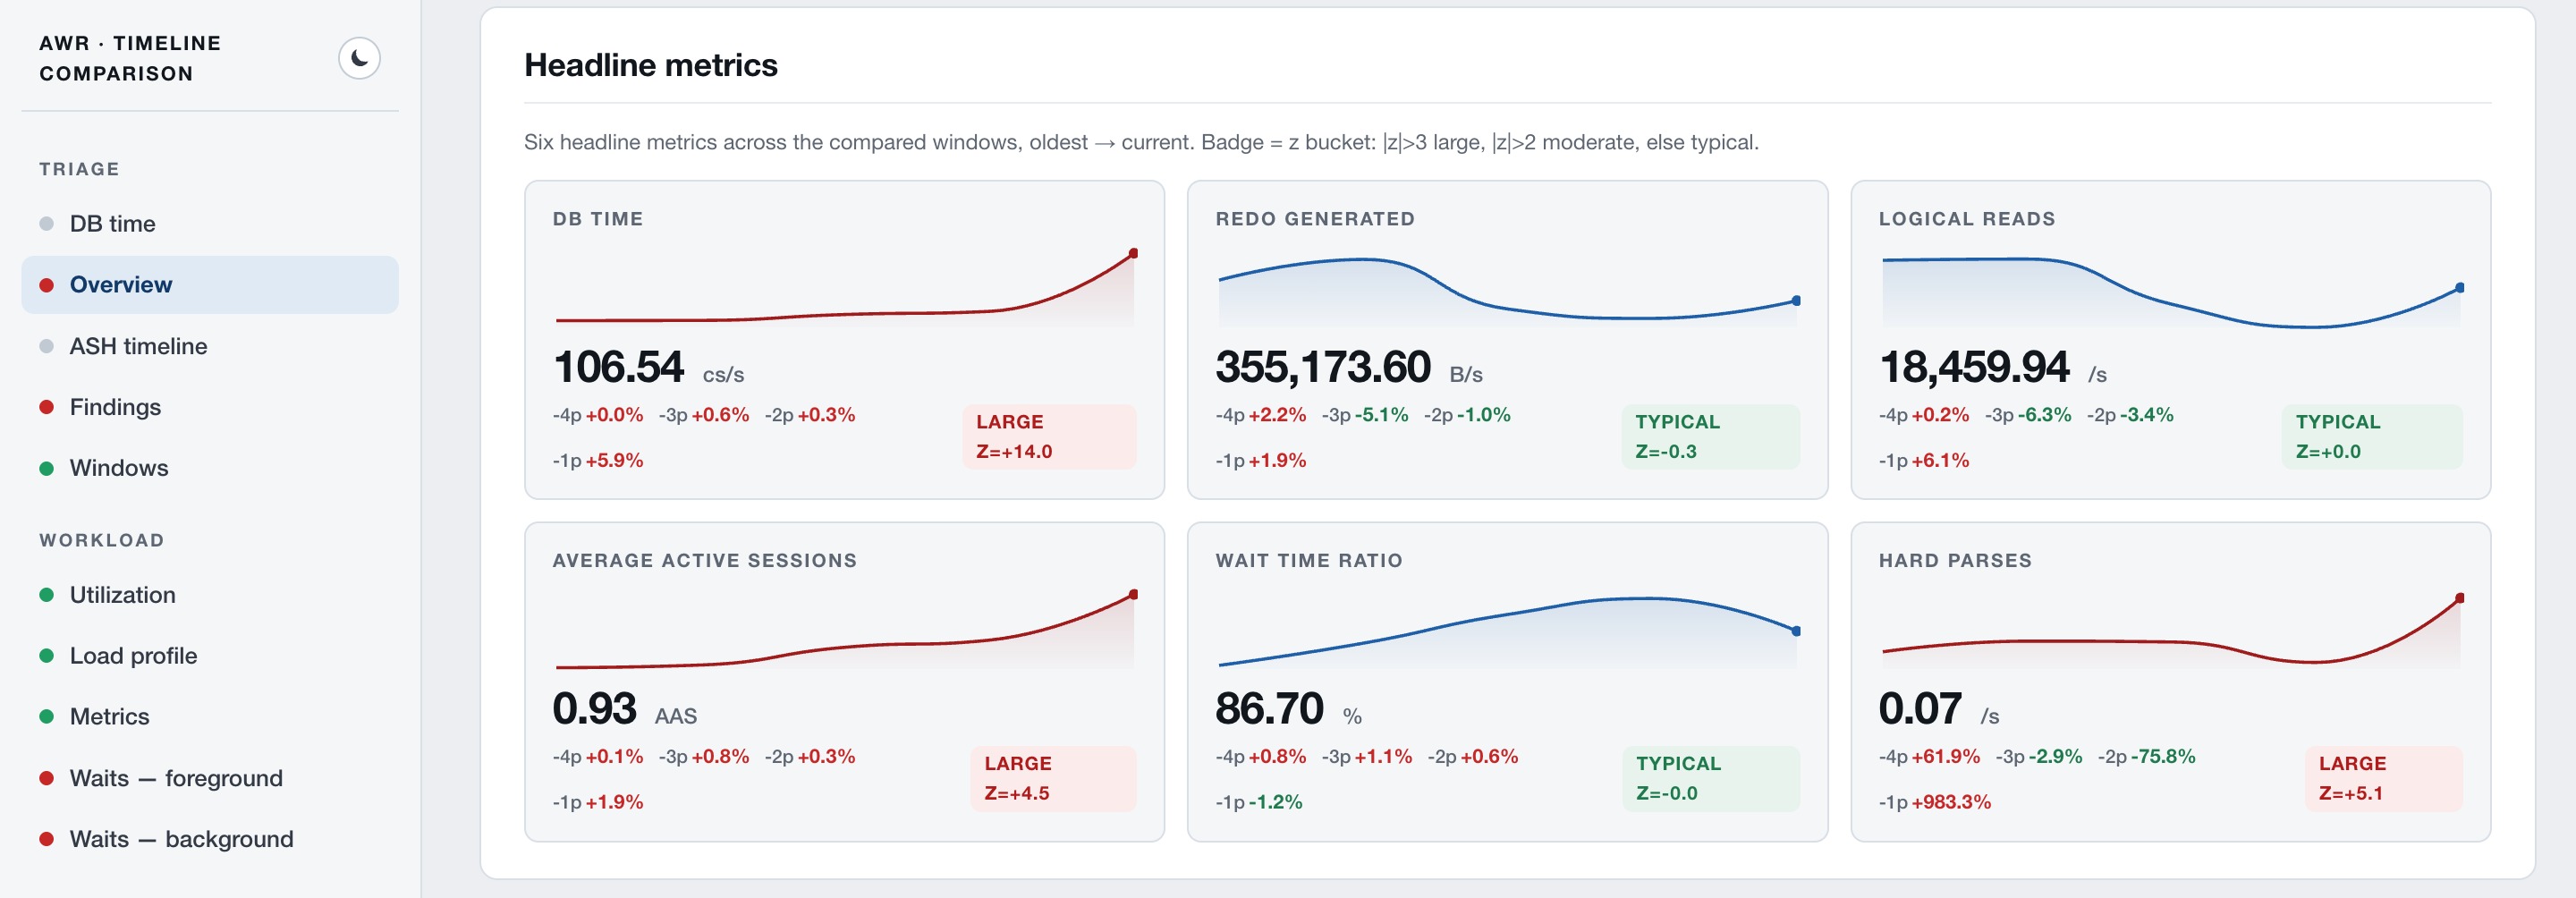
Each database is one dense, collapsed row — status dot, severity score, crit/warn pills, current AAS, its worst finding, a DB-time sparkline and a 24-hour ASH-by-wait-class ribbon. Click a row and it expands in place into a full detail panel: a tall 24h ASH timeline, headline metric cards, the findings table and the Top-SQL table.
# alias        | connect
prod-emea      | /@PRODEMEA
prod-amer      | /@PRODAMER
reporting      | reporting_ro/@RPT
./run_awr_fleet.sh fleet.conf

# mark a fleet-wide event on every DB's 24h ASH chart:
MARKERS='2026-04-20 14:00|Applied patch 19.22' ./run_awr_fleet.sh fleet.conf
- A database that is unreachable, times out, or spools a truncated fragment becomes a red error row sorted to the top — silence is never mistaken for health.
- Every row prints the exact drill-down command to open the full single-DB report for that database.
- Fleet-wide timeline markers are drawn across every database's ASH chart at the same instant — a release or patch lines up visually across the whole estate.
- Inline-SVG only, offline-complete, read-only; credentials are masked in every log and report.
Full reference — fleet.conf format, scoring, every environment variable — in the
Fleet section of the README.
One database, in depth
The single-DB report answers “is this database behaving the way it did before?”
It lines up the same hour of the same weekday across the past weeks — this Monday
09:00–10:00 against the four prior Mondays — so the normal weekly rhythm is never mistaken
for a problem, and grades every metric against its own history:
|z| > 2 Warning, |z| > 3 Critical. Inside: hero cards, an
ASH timeline, a findings heatmap, load profile, waits, Top SQL ranked five ways with per-SQL
ASH breakdowns, segment & file I/O and parameter changes — plus dark mode and the
Essential-rows / Application-only toggles, all client-side.
# defaults: current hour vs the same hour on the 4 prior weeks
./run_awr_trend.sh user/pw@svc

# a specific Monday morning vs the 4 prior Mondays
./run_awr_trend.sh user/pw@svc '2026-04-13 09:00'

# last 4 hours, hour by hour
./run_awr_trend.sh user/pw@svc AUTO 1 4 10 0 1 h

# lean triage report
./run_awr_trend.sh user/pw@svc AUTO 1 4 10 0 1 w simple

# annotate the timelines with your own milestones
MARKERS='2026-04-20 14:00|Applied patch 19.22' ./run_awr_trend.sh user/pw@svc
Unsure about the argument order? Run the interactive configurator — it walks you through every option with defaults and validation, then prints the ready-to-paste command. The web configurator does the same in your browser, and the cheat sheet has the full argument reference plus ready-to-paste recipes (hour-by-hour walkthroughs, batch-window checks, quarter-over-quarter, offline reports, markers).
# also -c, -i, --interactive, or just run with no arguments
./run_awr_trend.sh --configure
SQL> @sql/defaults.sql
SQL> @awr_trend.sql

-- or customize one-off:
SQL> DEFINE target_end = '2026-04-15 09:00'
SQL> DEFINE win_hours  = 2
SQL> DEFINE weeks_back = 6
SQL> @awr_trend.sql
The report lands in
reports/awr_trend_<DBID>_<timestamp>_run<run_id>.html —
open it in any browser, attach it to a ticket. RAC and multitenant (PDB / migrated-PDB)
are handled; when history is too short to score fairly, the report says so instead of guessing.
Templates
The template argument picks which curated set of metrics and wait events the
single-DB report renders — same comparison engine, different altitude:
comprehensive- For DBAs. The default — the full curated lists and the complete firehose of wait events ranked by time.
simple- For triage. A quick-glance subset you skim in thirty seconds before deciding whether to dig.
dev- For application teams. What the application itself drives — throughput, query work, parsing, SQL*Net chattiness, app-caused contention — with host/OS and storage internals left out.
Rolling your own is a directory with three files under
sql/lib/templates/<name>/ plus one whitelist entry in the driver — see the
README.
Example reports
Real, unedited reports generated against a small Oracle 19c lab database — each a single HTML file exactly as the toolkit spooled it. Open them, scroll around, hover the charts.
The full report
Default template, hour-over-hour cadence: hero cards, ASH timeline, findings heatmap, waits, Top SQL, per-SQL ASH breakdowns — plus dark mode and the row filters.
Open report → simple · hourlyThe triage view
Same engine, template=simple: a lean subset of stats, metrics and waits for
a thirty-second skim.
With timeline markers
Run with inline markers: “Patch 19.22 applied” and “Index rebuild on SALES”
drawn on every dated chart.